I have been building systems for the healthcare sector for the last 13 years. Indeed, I often advocate using Excel as a getting started tool to help understand the requirements to build the main solution. I also have built solutions in platforms like Filemaker Pro and worked with developers building SQL server solutions.

The furore around Track and Trace prompted me to help to explain why Excel is a bad long term solution in the healthcare sector.

  1. Row Limit As someone involved in the UK track and trace programme discovered, it helps if you know your limits. Up until Excel 2007, it has only 65k rows. When you are dealing with several thousand new cases per day, it is fairly obvious that you will reach the threshold of 65k rows pretty damn fast.
  2. 1,000,000 rows Although Excel 2007 onwards has 1,000, 000 rows, I still would not use it for large datasets:-

a) I am convinced that when Excel has a large amount of data, its computations are incorrect and rounding errors start appearing.

b) It becomes extremely slow to operate – even more so when there are several hundred formulaes or you are summing across long ranges of cells.

3. Data Security Excel is not password protected by default – do you want to reveal peoples personal details through lack of basic IT security (your yahoo account is arguably more secure than standard Excel). In addition, Excel files can readily emailed to third parties with no accountability of where they are being sent to.

4. Usability of Data It is no good just being able to store data, you have to be able to access it in someway e.g find records that meet certain criteria like the number recorded on a certain day in a particular location. Although Excel has its Find and Filter functions they are rather primitive.

5. Data Granularity A key part of data analysis is understanding what a particular number is made up of e.g if we said there were 10,000 new cases yesterday, how easily can we break ths down into cases by Age or Location. Excel only has limited capability to do this.

One of the most common questions that I am asked is why should I replace my excel spreadsheets with a database … will it really stop me “having hell” with excel ? And people are curious as what are the benefits of having a database rather a spreadsheet ? So here are 10 top reasons for dumping your excel spreadsheet.

1. Improved security

In many companies, there is a need to keep certain data confidential whilst other data can be readily distributed. These sort of privileges can be difficult to adminster – especially when there several hundred documents. In a database, every user has their own access rights meaning that it is far easier to manage access rights to information, leading to improved data security.

2. Share information more easily

With a spreadsheet (or even word document), only one person can access the data at any one time. However with a central database, several people can look at the data at the same time.

3. No more multiple data entry

Ever wondered just how much time you waste by copying and pasting data between documents ? In a database, you eliminate this time as all data is stored centrally.

4. Improved data consistency

As all data is stored in one place, it means that the entire organisation uses the same data rather than different versions e.g address spellings which results in improved data quality

5. Effective version control

One of the problems that I see often see in organisations is that people get confused between various versions of documents. A database ensures that everybody sees the same verison of the document. Further it is easy to keep a log of all the previous versions.

6. Enhanced Business Intelligence

with a database it is easy to set up a dashboard to spot potential problems in the business e.g any deadlines or payments that are overdue. As they are highlighted automatically, it gives you more time to track and manage the issue before it becomes a serious problem.

7. Effective reporting

Management need up to date information to make robust decisions. Often the data for this comes from several sources meaning that it takes time to assemble. With a database, report production can be automated – saving time

8. Drill down capability

With an excel spreadsheet, if we wanted to drill down e.g : see all the orders placed by a given customer or all the items that on an order, then it is not easy to present this information. However, in a database you can achieve this functionality very easily.

9. More comprehensive layouts

in an excel spreadsheet you can only place information in specific cells or rows. However, with a database it can be placed in a manner that you choose, meaning that you can bring together data in a much more meaningful manner.

10. Mobile devices

A database can be designed so that it fits neatly onto a mobile phone or tablet. So for example you can see on your tablet which customers owe you money or tasks that need doing a certain day. As the data is updated in real time, staff working remotely can have the same view of the data.

What is Management Reporting

Most people I know are keen sports fans of some kind or another. They regularly track the performance of their favourite team against their expectations or even their fantasy teams. Yet it is surprising how many business owners actually neglect to do the same.

Over the years, I have spoken to several business coaches and accountants who categorically state that if a business is to thrive then they must review their business progress on either a quarterly or monthly basis.

The reverse will also apply – those that struggle and go under usually spend minimal (if any time) on these processes.

Generating this information is called “Management Reporting”.

You may suggest that your accountant produces your accounts every year and it can constitute management reporting. I would say categorically say that it is not – as:-

  • Your accountant will produce information which is often a year out of date – to keep ahead of your business you need info which is created monthly or quarterly.
  • returns will lack the detail that you require to analyse your business effectively. For example the accounts will show only the annual turnover that has been made – not your monthly turnover

A Management Reporting Pack

So where to start ? The simplest way would be to make a list of questions that you would like to answer about your business and then gather the information that can help you answer these questions:–

  • How much turnover do I generate in a month ?
  • Who are my biggest customers ?
  • What do I spend on overheads ?
  • How long do my customers take to pay me ?

You can set up a Management Reporting pack in an excel spreadsheet and modify it over time. You could consider having a seperate tab for each months activity and then a summary sheet that gives you a high level overview.  This information could be displayed on a graph. A simple graph showing your actual sales versus your expected sales can be a real eye opener.

As you become more confident, you can develop the spreadsheet and even consider automating it. I remember one of my first clients who used to take 8 hours a month trying to reconcile the actual business activity with the expected. I managed to redesign the management reporting spreadsheets so that it produced all the information automatically.

My client said that as well as saving him 8 hours a month, it also saved the business and probably his marriage . He could see how his busness was performing and was able to take rectifying action within a matter of weeks.

Yes in this blog I’m going to prove that process automation in your business can improve your sex life. This statement is actually based on a case study that happened several years ago.

The Challenge

My client was an international finance company based in London and Krakow (Poland). They had two directors – one based in each location. The London director looked after sales, whilst the Polish director foused on service delivery.

Once a month, the two directors held a meeting in which they reviewed the business performance. Prior to the meeting, the directors undertook a manual reconciliation process that compared the actual performance with the expected performance. However this was:-

  • an incredibly time consuming process taking 8 hours
  • invariably wrong due to the amount of data entry involved

In addition, as the process was so cumbersome it created considerable conflict between them. Indeed the business was stagnating because of the lack of having clear understanding of the numbers.

How we acheived process automation

Fingertips Intelligence implemented process automation by consolidating the existing spreadsheet systems into a single spreadsheet so that all the data flowed through the workbook. This was in contrast to the original process where the data had to be entered several times – which invariably resulted in errors.

Following the process automation, the updated spreadsheet:-

  • was instantaneous – immiediately saving them 8 hours a month
  • gave them an accurate picture of the business
  • contained graphs as well numbers so they could easily see what was happening on their business
  • allowed them to focus on growing the business rather than arguing with each other.

And Finally …

Having eliminated a very manual and cumbersome process, through process automation the directors were able to see the true state of the business and focus on growing it steadily rather than arguing with each other. Consequently they brought the business back from the brink, and turnover improved.

So why is an automated spreadsheet process benefical for your sex life ?

Well once they automated the most tedious part of their business, they weren’t so stressed. However as the turnover increased, the directors wives were a lot happier ….

Introduction to Dynamic Charts

Most excel users know how to create Excel charts by selecting a group of cells and clicking on one of the chart designs at the top

.


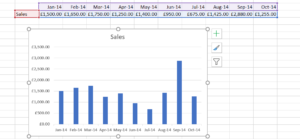
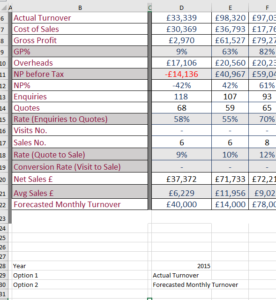
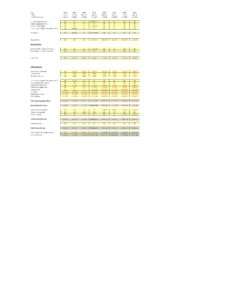
In this case, the chart is easy to produce because we only have one row of data covering just 10 months. However, what about if we had the data below :-

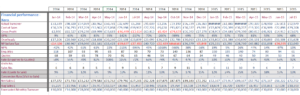
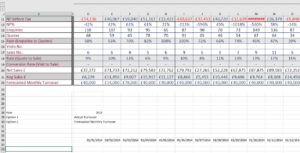
We have 17 rows of data and in fact the data goes up to 2019, so there are over 60 columns of data. The initial temptation might be to draw 17 graphs – which would probably result in either “Hell with Excel” or analysis paralysis.

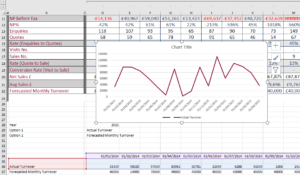
However, Excel offers another solution – dynamic charts – where you can select the data item (e.g actual turnover) from a dropdown, and the chart updates with the values from the relevant field:-

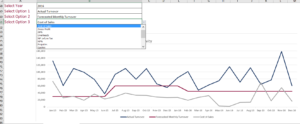
So In the chart above, the user can select up to three options and the chart will pull through the values automatically. This is another big advantage of dynamic charts – it is very easy to do adhoc comparisons of data.

In addition, the solution permits the user to select which year they want to view. Hence if we have  several years of data, and only want to watch a snapshot, the user can select the relevant year from the dropdown. We have set it up so that the user can compare the selected year with the previous year.

How to create a dynamic chart

The key to creating a dynamic chart is the way that the data is set up. In particular it should be a single tranche as per the diagram above. One thing I would recommend is to extend the time period so that it includes say the next 3 years from the outset:-


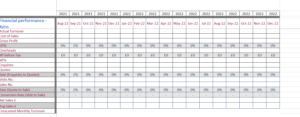
This means that the person doing the data entry won’t have to come back to you each year to update the formulae.

There are three key stages in setting up a dynamic chart:-

  1. Creating the data entry area – where we specify the year and drop downs for the values.
  2. Setting up a mini data table – which uses the values from the drop downs to pull the data from the main tabl
  3. Set up the graphs using the values in the mini data table.These are explained in more detailed below.

Step 1 – Creating the data entry area

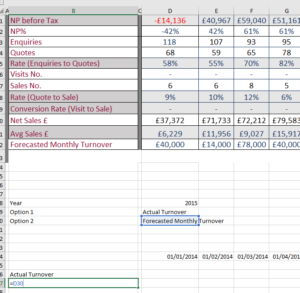
In this stage, we set up the interface so that the user can specify the years and create the drop downs. Note for simplicity, we will keep everything on the same sheet.So in cells B28,B29 and B30 enter the values Year, Option 1 and Option 2 as per the screenshot below:-


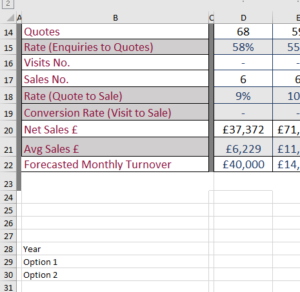
For simplicity, we just going to do a dynamic chart that allows the user to compare two values. However, it can easily be extended to have additional values.

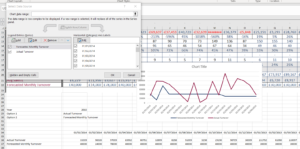
The next step is to set up a couple of named ranges called “Graph_Options” and “Years” respectively:-

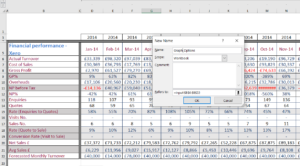
Named ranges can set up via the formulas option on the main menu. In this case,the named range consists of the values in the range B6:B22 – which are the possible options for the graphs.We also need to set up one for the years. In this case we need a blank area of the sheet – which the user won’t see (I often use a separate sheet) and type in the consecutive values for the years:-


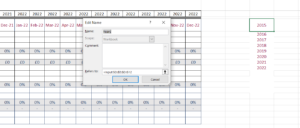
Observe that we start the values for the year from 2015 rather than 2014,as in the dynamic chart we are comparing one year with a previous year. So when we select 2015, the previous year is 2014.

Now go back to the left hand side of the sheet, and use data validation to restrict the values that can be entered in cells D28 (for the year) and D29 & D30 for the graph options:-


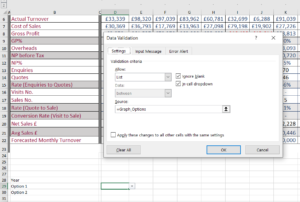
Then use the drop down to select the values. For now we will select the values 2015, Actual Turnover and Forecasted Monthly Turnover:-


That completes setting up the data entry part.


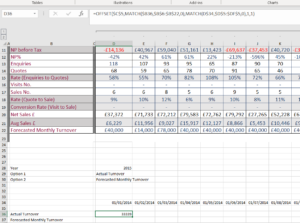
STAGE 2. Setting up a mini data table – which uses the values from the drop downs  to pull the data from the main table.

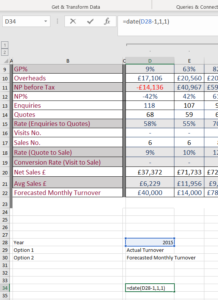
The first part of the data table is to create the monthly timeframe. Using the date function, we enter the formulae above in cell D34. This sets up a link to the 1st of January of the selected previous year. So if cell D28 has the value of 2015, then the formulae above gives the value 1/1/2014.

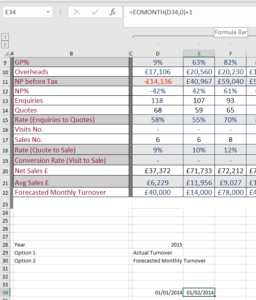
We now need the next 23 consecutive months in our formulae. Excel’s EOMONTH formulae can be used to specify the end of a month whose value is stored in another cell. So for example, if we have the date 23/04/2015 in cell C12 then putting the following formulae in D12:-

D12 = EOMonth(C12,0)

Will return the value 30/04/2015 – the end of the current month. And if we want the first of the next month we just add one:-

D12 = EOMonth(D12,0)+1

Which returns 1st May 2015.  This is how we start to create the time line for the graph :-

And we now need to have a slightly different formulae in the adjacent twenty two cells to get the full time line for the dynamic chart:-


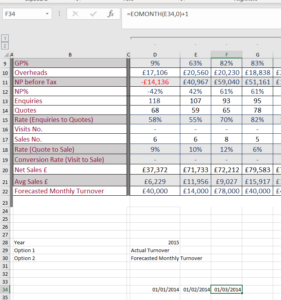
And now we drag this third formulae to the right to complete the time line – which should be 24 columns showing adjacent months.  Altering the value in D28 will automatically adjust the values in the timeline.

The next step is to incorporate the two axis into the data table. These are just cell references to the values in cells B29 and B30. So in cells b36 and b37 put “=b29” and “=b30” respectively:-


The next step is the most challenging – populating the mini data table using the values from the axis and the timeline. It uses a combination of the OFFSET and MATCH functions to do this. The OFFSET function allows to return cell values relative to an “anchor” cell. The MATCH function returns the position of one value within another range.

Enter the following formulae in cell D36 – which will be the intersection of the first month and first axis option in the datatable:-

=OFFSET($C$5,MATCH($B36,$B$6:$B$22,0),MATCH(D$34,$D$5:$DF$5,0),1,1)

And now drag this formulae across both axis of the time line – to complete the values in the datatable:-


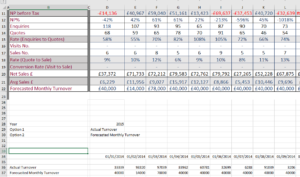
If you use the dropdowns in cells D28, D29 and D30 then the data table should update automatically.

  1. Set up the dynamic charts using the values in the mini data table.

This is the final part of creating the dynamic charts – actually creating the chart. Highlight the first row of the datatable and insert a standard line chart:-


This is the first axis in our graph. We can click on the graph, and select the data source to specify the second axis:-

Closing the pop up, we now have a dynamic chart – that allows us to select two rows from the main data table and compare.


Fingertips Intelligence have been doing database design for over 10 years and we like to give our clients plenty of advice before we start their project. If I could summarise all that knowledge into one page then it would be –

1. A database is a business tool and has to fit your business. It may seem obvious but if the database design does not operate the way you want it to, then it is useless. That’s irrespective of how it looks, what it does, or any fancy add-ins.

2. Do not make the initial scope too big. For most SME’s – a good database is one that will get delivered in under 3 months. Focus on the core problems you are trying to solve in the initial build and then plan for subsequent stages.

3. Consider the processes that underpin your business and how they function – and how they could be improved by having a database. E.g invoicing – consider just  customer invoicing for now :

  • It would be good if the system collated all the line items automating – having the invoice generated a click of a button
  • Have the customer details appearing on the invoice
  • Generated the next invoice number
  • Emailed the invoice to the customer

4. Think about having a dashboard showing what is going in the business and all show potential problems at a glance:-

  • Overdue invoices
  • Orders that are in production / about to be delivered

5. Joining up disparate information sources – to generate simple but effective business intelligence e.g :-

  • Before you might have had separate spreadsheets showing customers and their orders – now having a single comprehensive database can show you which customers are buying which services
  • Suppliers and stock levels – are different parts of the organisation using their own suppliers to purchase the same product ? Using a single database can highlight this and enable you to consolidate your purchasing

6. Management Reporting – this is one of the most important aspect of  database design – to be able to provide management with effective business intelligence at a click of a button. If a database has been well designed then these reports should be easy to create.

Ever wondered what benefits would happen, if you automated the production of your invoices (cf invoice automation). Here are 10 possible ones:-

1. Imagine the time you’d save

Have you ever worked out the time you waste on generating invoices by hand ? I had a customer who gained an extra 15 working days a year by no longer producing his invoices by hand..

2. Better Branding

By implementing invoice automation, invoices will have exactly the same look and feel – making you and your organisation look much more professional.

3. Enhanced cashflow

Most people hate repetitive tasks such as invoicing – if you simplify a task then you will do it earlier. The earlier you dispatch your invoices, the faster you should get paid.

4. Lower overheads

A manual invoicing system will involve either your time or your staff’s time (with you double checking everything). If you automate your invoicing, then you save this cost.


5. Sequential invoice numbering

How many of us leave gaps in our invoice numbering ? i.e going from invoice no. 182 to 184? In the UK, HMRC (Her Majesty’s Revenue & Customs) take a suspicious view of gaps in invoice numbering. By automating the production of your invoicing,you eliminate this risk.

6. Improved payment profile

By generating your invoices automatically, you can generate the payment due date automatically. This means you can track those invoices that have not been paid on time.


7. Determine your best and worst customers

If you have a system that creates your invoices automatically then you can analyse who are your worst and best customers. This can be used to identify better sales opportunities.

8. Identify your best sellers

A well built automated invoicing system will allow you to determine which products you are selling and who to. Hence you can use this to determine possible further sales opportunities.

9. Reduced accountancy & book-keeping costs

If you generate our invoices manually then you probably provide your accountant and book-keeper a stack of paper. However if you automate your invoicing then you can provide them with the summary information that they need – saving you money.

10. Have a break

Well if you save yourself 15 working days a year and your cashflow improves through better payments…then I’d say you deserve a holiday!

Introduction

Many people dismiss Filemaker Pro as a platform suitable only for very small businesses. However a quick search of the internet shows that many larger companies including Pret A Manger and Eurostar use it. The platform operates in the following enviroments:-

  • Windows desktop
  • Apple Mac
  • ipad
  • iphone
  • via a web browser

Some example projects that we have worked on include:-

  • For a chartered Financial Planner we built a platform that enabled him to do his client valuations, projections and reporting
  • For a City Mergers and Acquistion firm we developed a tool that allowed them to track their sales pipeline
  • Bar code scanning system for plumbers merchant

Here are some of the things that we have learnt over the last 5 years in building systems with Filemaker:-

Understand why the solution is being built in Filemaker Pro

The software industry is an evolving beast with new products coming on the market every day. One of the first things that we say to any client is why do you feel the need for a bespoke solution. What research have they done  for products on the open market that are suitable for your vertical sector ? If they have not, then they really need to. In addition, can you quantify the amount of data that is required and  the complexity of the relationships between them ?

Data Migration

How much data needs to be moved from the old system to Filemaker Pro ? If it is just customer names and addresses from an excel spreadsheet than that is easily acheivable. However if you need to migrate data from an existing database which has several tables and many hundreds or thousands lines of data then how will you go about that ? The situation may be even more challenging if content such as images and video are involved. Also can you actually access the data ? We had one case where they had lost the original user name and password to enter the old system. Fortunately we were able to get in using an ethical hack.

Infrastructure

Filemaker Pro is a hosted solution – and hence the quality of the infrastructure is paramount to the success of the project. So we consider the clients internet speed, the hardware being used etc. There are some clients who still need to use a wired ethernet cable to connect  their PC’s to the web, and these are likely to have slower internet speeds – which can have an impact on performance. Some clients also use Microsofts Small Business Server – which is incompatible with Filemaker Pro Server. In these cases the solution would be to host the solution on an external database server.

Its not a word processor

Many people believe that that a database is a snazzy word processor, which is simply not true. So look at the required outputs and see how easily they can be produced in Filemaker Pro. If the client has text which is reasonably standardised or items from a pick list then it should be possible to build the system.

Use the latest version

We do get asked to help with systems that are built in very old versions of Filemaker Pro. However we insist that the client upgrades to the latest version (currently Version 16) as it is better for both the client and us if they do so. Hence the needs to factor in the cost of upgrading to the new licences as well as development time.

Installation Time

Unless the client is using purely the web direct version of Filemaker Pro, then a licence will need to be installed on every machine. Hence, if there are a large number of users, the time taken to install the device on each machine must be factored in.

Scope Creep

Clients appear go to on an evanlegism when they start having solutions built for them. As the journey progresses they have an ever increasing wish list. Hence it is paramount to define the scope upfront and continually remind them of it.

About the author

Kapil Kapur is the Managing Director of Fingertips Intelligence, who help companies make better decisions faster – through building bespoke dabase systems. If you would like an informal chat on how we can help your business then please get in touch on info@fingertips-intelligence.co.uk.

One of the most common questions I am asked is why exactly should I replace my spreadsheets with a central database. Here are 10 good reasons:-

1. Sharing information – With a spreadsheet (or even word document), only one person can access the data at any one time. However with a central database, more than one person can look at the data simultaneously

2. Elimination of multiple data entry – ever wondered just how much time you waste by copying and pasting data between documents ? With a central database, as all data is stored centrally, there is no need to copy data – saving you all this time

3. Improved data quality and consistency – As all data is stored in one place, it means that everybody uses the same data rather than different variants e.g different spellings for somebody’s address

 4. Effective version control – One of the problems that I see regularly in organisations is that people get confused between various versions of documents. Using a well built database, it means that everybody can easily see the latest version of a document

5. More robust security – In many companies, there is a need to keep certain data restricted, whilst other data can be readily shared. These sort of privileges can be tricky to maintain – especially when there several hundred documents. In a database, every user has their own logon credentials meaning that it is far easier to manage access rights to information.

6. Mobile devices – with a bit of thought, a database can be designed so that it fits neatly onto a mobile phone or tablet. Further, information can be exchanged in real time between the database and the mobile device – so your mobile workforce can see up to date information in real time

 7. Faster reporting – Management need accurate information to make decisions more effectively. Often the data for this comes from several sources meaning that it takes time to assemble. With a database, the report production can be automated – saving time.

 8. Drill down capability – with an excel spreadsheet, if we wanted to drill down e.g : see all the orders placed by a given customer or all the items that on an order, then it is not easy to present this information. However, in a database you can achieve this functionality very easily.

9. More sophisticated layouts – in an excel spreadsheet you can only place information in specific cells or rows. However, with a database it can be placed in a manner that you choose, meaning that you can bring together data in a much more meaningful manner.

10. Click through capability – with a database, you can click on a piece of data and follow it through easily e.g:-


  • Click on a customer and see all his orders
  • Select one order and see what items have been purchased in an order
  • Take one item and get a description of the item
  • Identify other orders that contain this item – across all customers
  • Get reports about when and how often this item is purchased
  • Use this information